Solana (SOL) appears ready for a significant breakout as its weekly chart reveals a compelling bullish setup. Over the last few days, Solana’s price has been consolidating despite hitting a new all-time high on November 22.
But if the altcoin breaks through critical resistance levels, it could hit $300. Here is how.
Solana Has Indicators on Its Side
On Solana’s weekly chart, the altcoin has formed a classic bull flag pattern — a bullish indicator suggesting potential further upward movement.
A bull flag consists of two rallies separated by a brief period of consolidation. The flagpole forms during a sharp, nearly vertical price spike as buyers overpower sellers. This is followed by a pullback phase, creating parallel upper and lower trendlines that resemble a flag.
As seen below, SOL has broken out of this pattern, indicating that the consolidation period is over. Hence, the uptrend could continue, and the token could be set for a sustained rally. If this trend continues, Solana’s price could climb above its all-time high of $264.66.
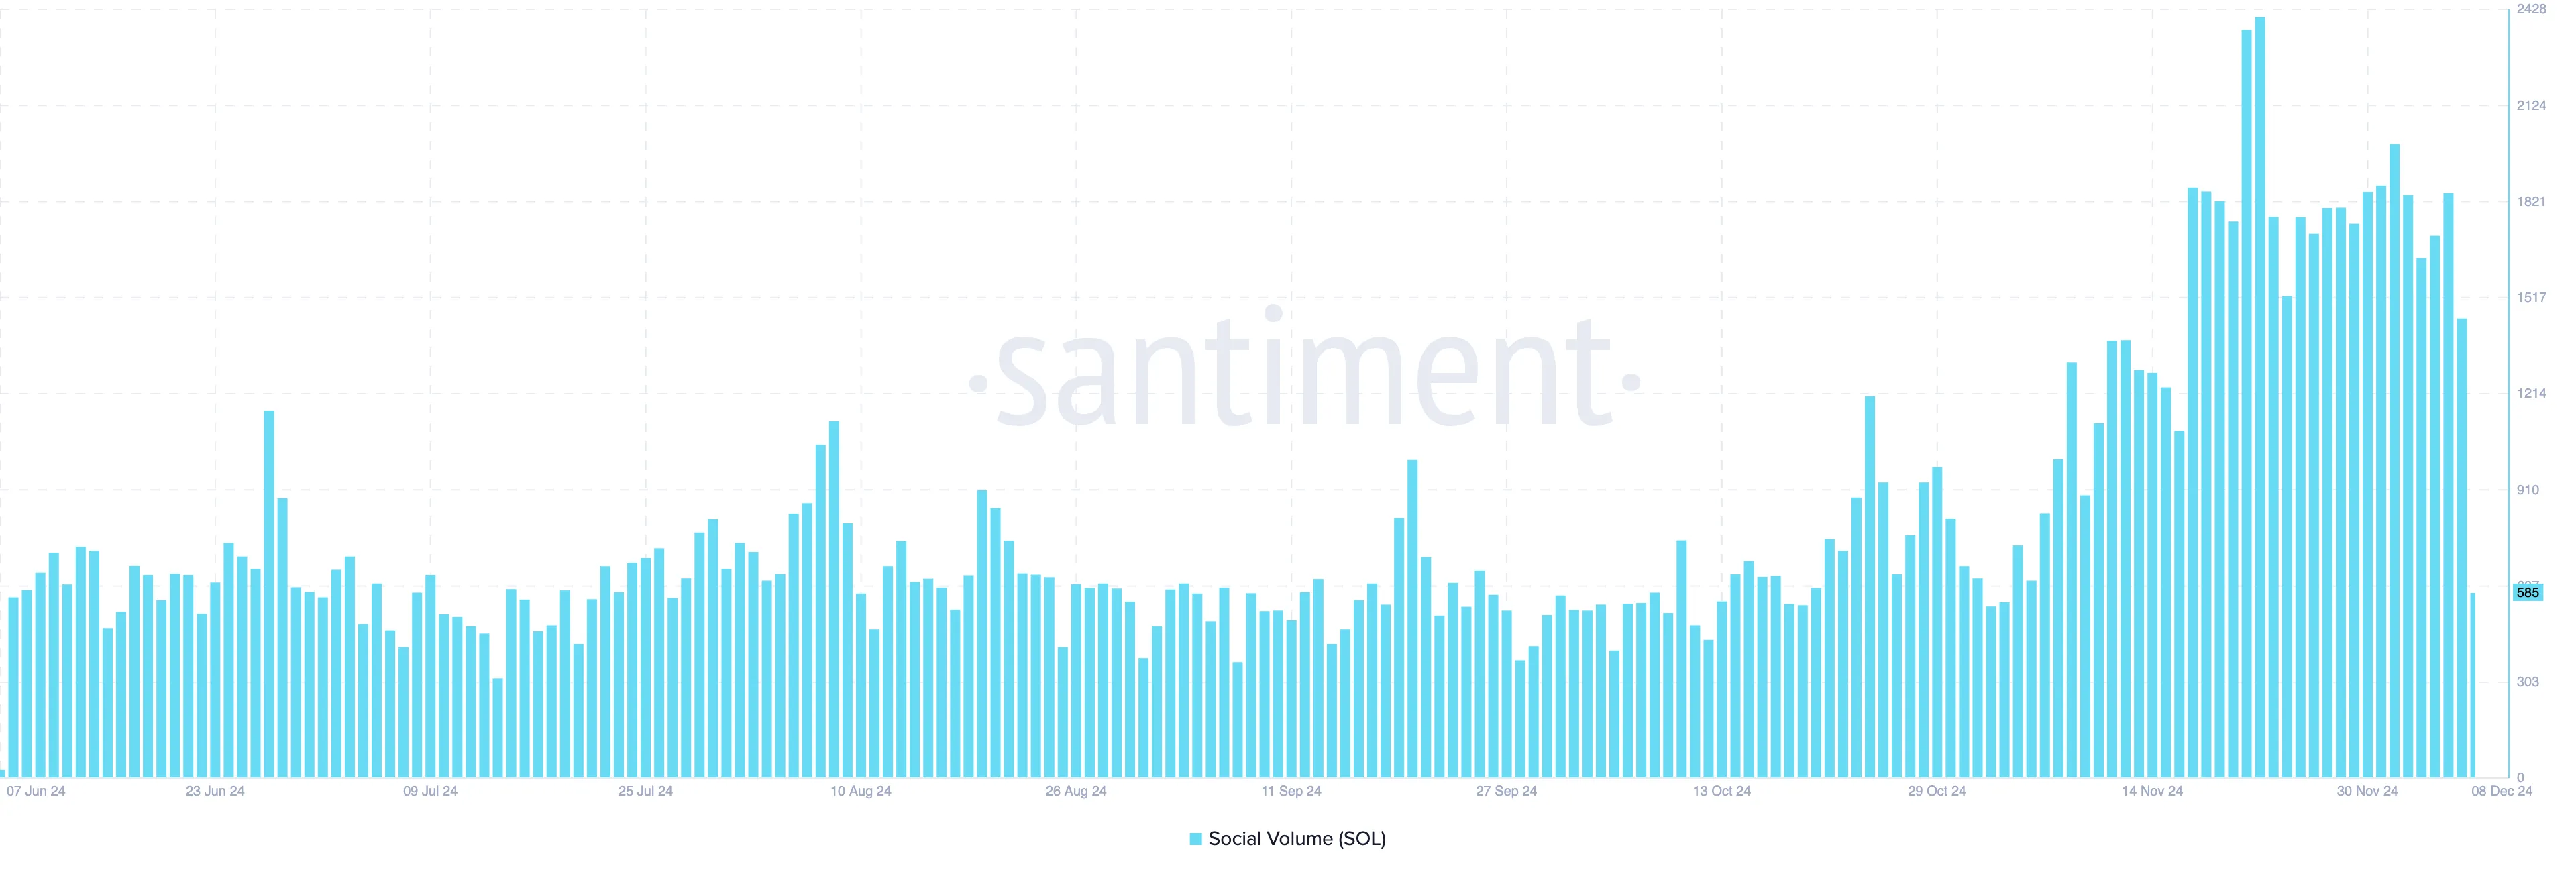
Amid this bullish setup, on-chain data from Santiment shows an increase in Solana’s social volume. Built on top of social data, this metric measures the search text related to a cryptocurrency on different online platforms.
When it increases, it implies that the search for the assets has increased. In most cases, this translates to rising demand. On the other hand, a drop in social volume indicates that the search for the assets has dropped, suggesting low interest in the cryptocurrency.
Therefore, the recent rise in SOL’s social dominance suggests that, if sustained, the token could soon trade higher than $236.
SOL Price Prediction: Consolidation Almost Over
Meanwhile, on the daily chart, SOL price is trading above the Ichimoku Cloud. The Ichimoku Cloud is a technical analysis tool designed to identify support and resistance levels, momentum, and trend direction in a single view.
Comprised of multiple components, the indicator offers insights into potential price movements. The cloud itself represents key support and resistance zones.
When the cloud is above the price, it indicates resistance, suggesting that retracement could be likely. But in this case, Solana’s price is above it, indicating strong support.
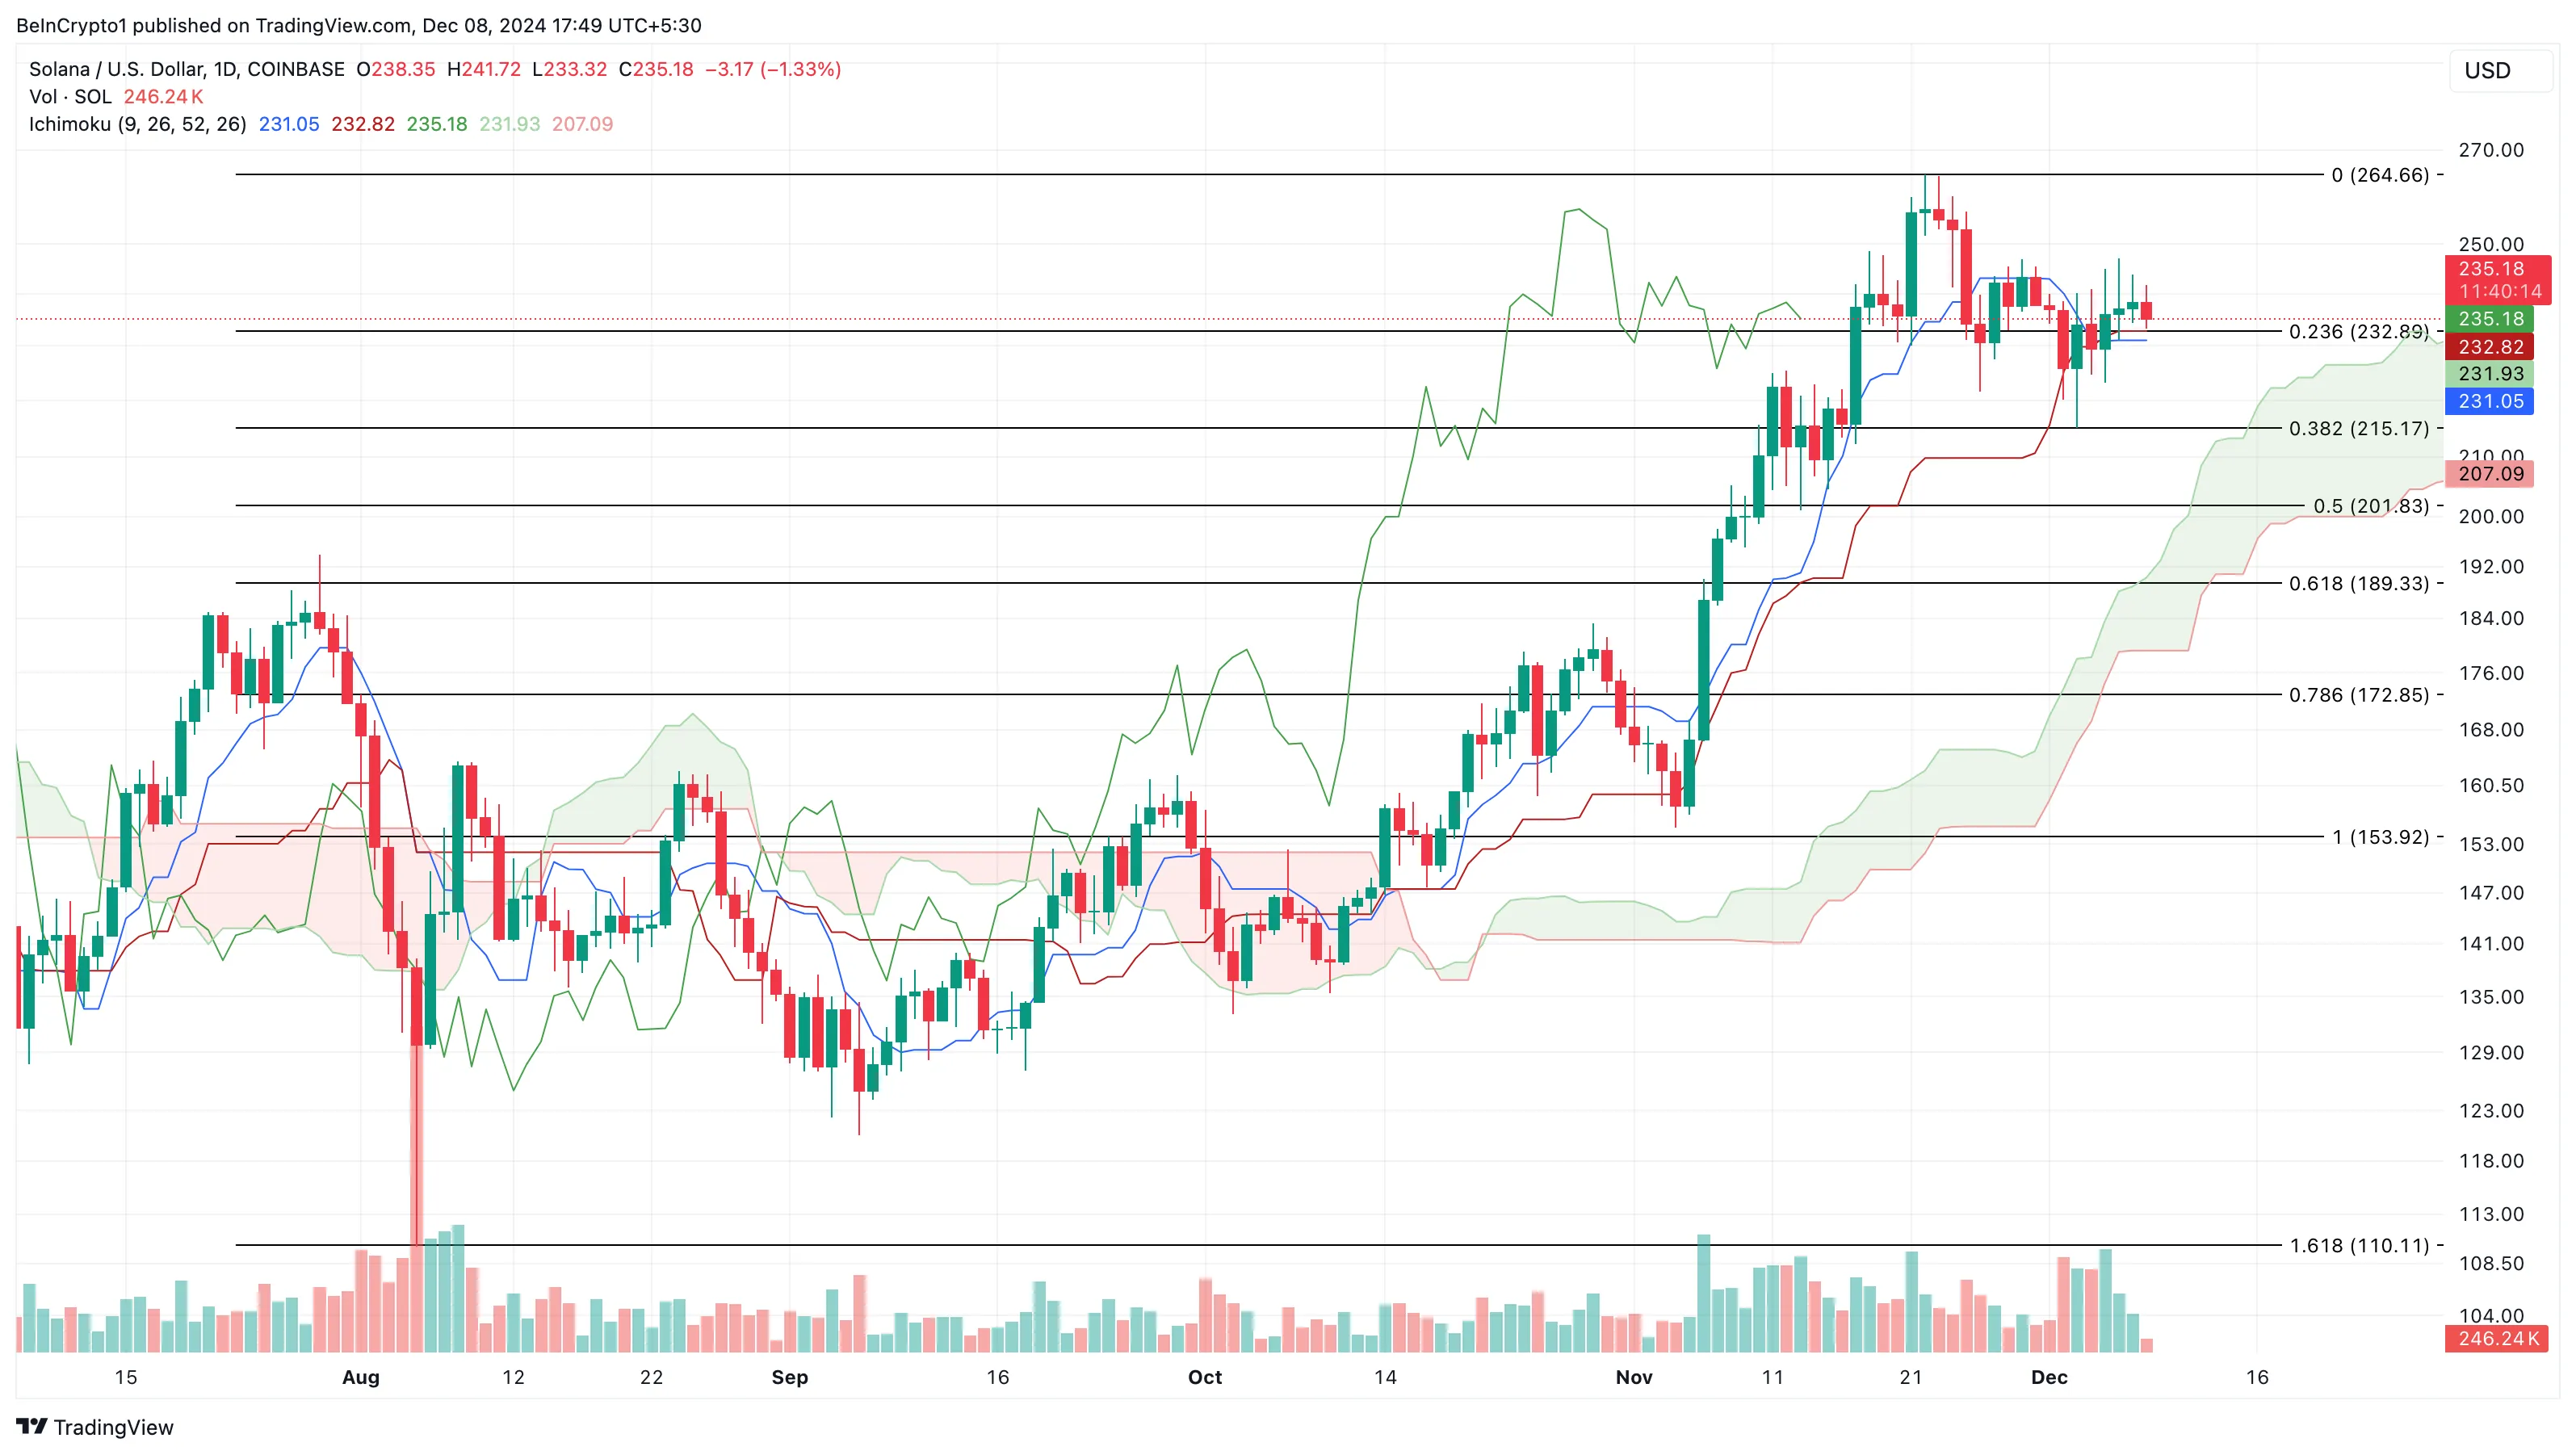
If sustained, then SOL might rise above the all-time high and climb to $300.On the other hand, if it encounters resistance on the Solana weekly and daily chart, the price could drop to $215.17.
Disclaimer
In line with the Trust Project guidelines, this price analysis article is for informational purposes only and should not be considered financial or investment advice. BeInCrypto is committed to accurate, unbiased reporting, but market conditions are subject to change without notice. Always conduct your own research and consult with a professional before making any financial decisions. Please note that our Terms and Conditions, Privacy Policy, and Disclaimers have been updated.

